
by: Luca Barcelo, Abhishek Deshwal, & Pratik Jaideep Potdar
ISO-NE expects to install a total wind generation capacity of 12,000 MW by 2030 and would like to study how to best integrate wind generation. In this study, we provide suggestions to decarbonize ISO New England in a one-bus system model, specifically, we explore the best ways to integrate wind energy in the grid of New England and find optimizing factors. We do this for 4 cases: No wind integration, and with wind capacities of 2000 MW, 6000 MW and 12000 MW. After analyzing data for one week (168 hours), we find that wind integration brings significant benefits - lower costs and emissions and less volatile prices. Almost all the available wind capacity is utilized under all scenarios, even without incentives. Importantly, we observe that adding a carbon tax or giving subsidies doesn't really reduce emissions and increases the cost to consumers, while also reducing generator profits. Additionally, for all wind capacities the wind curtailment ratio is close to zero, which suggests that most of the wind energy produced gets used anyways even without taxes. We propose that a high wind capacity installation regime (12000 MW) without taxes/subsidy would achieve its intended purpose.
ISO-NE is trying to see how much wind is best to integrate, and in what ways and using what techniques, so our analysis parallels these motivations. The model in this paper has 8 buses with no transmission limits, so it is equivalent to a single-bus model (ISO New England has minor congestion issues). We use one week (168 hours) of data including wind generation capacity factors and demand.
We intend to find the economic viability of wind integration and its benefits to the system. We also explore if carbon taxes or subsidies are a necessity to effectively integrate wind in the current system of NE. Wind energy is clean and renewable and there is a need to check the economic viability before installing it at a location.
We formulate this problem as an optimization problem and then simulate for various scenarios of wind capacity and taxes/subsidy. Key outcomes we consider include system costs (objective function), prices, carbon emissions, generator profits and WCR. We describe the mathematical setup with the following equations and constraints. Grouping terms within CVXPY yielded results through the Gurobi Solver:
Objective Function

| emissionsIntensity = 1.1 ton/MWh[1] |
| Tax = levied carbon tax |
Generator Limit Constraints

Ramp Constraints
 |
 |
Start-Up & Shut-Down Logic
 |
 |
 |
Demand-Based Power Balance
 |
System Reserve
 |
 |
 |
Wind Generation Limit
 |
1. Increasing wind generation capacity reduces both system power generation cost and carbon emissions
Figure 1 (a) and (b) summarize this. The total cost of meeting the exogenously given energy demand over the 168-hour period decreases progressively as more wind capacity is installed. System cost reduces from $92.5 million for the base case of zero wind capacity to $49 million when the capacity is increased to 12000 MW.
Incremental reductions in carbon emissions from increasing wind capacity is modest except the case when capacity is increased to 12000 MW. The base case estimates project carbon emissions at ~2.4 million metric tons. Integrating just 2,000 MW of wind does little to reduce emissions (drop of 100k metric tons) but integrating 12,000 MW demonstrates a considerably larger reduction in emissions (drop of ~600k metric tons) or 25% of total prior emissions.
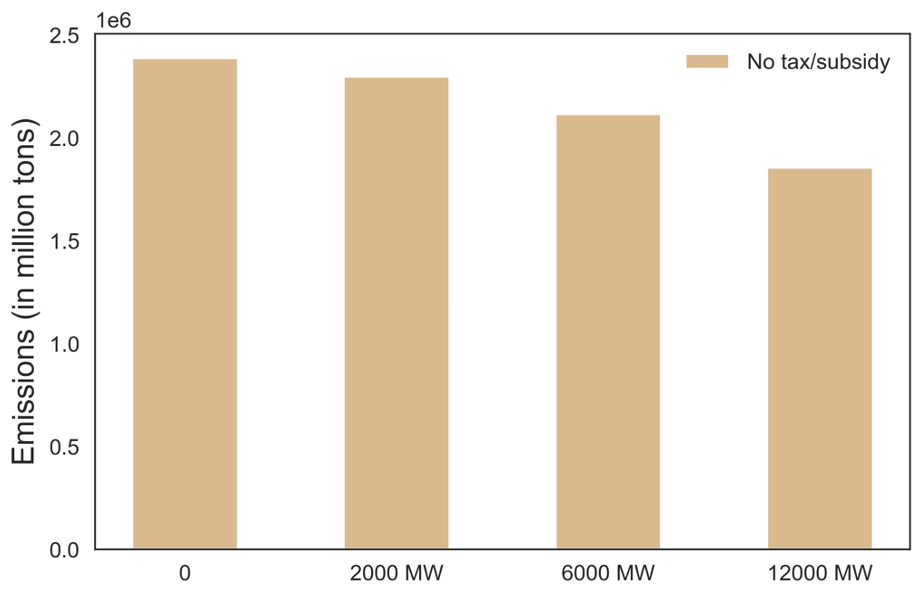
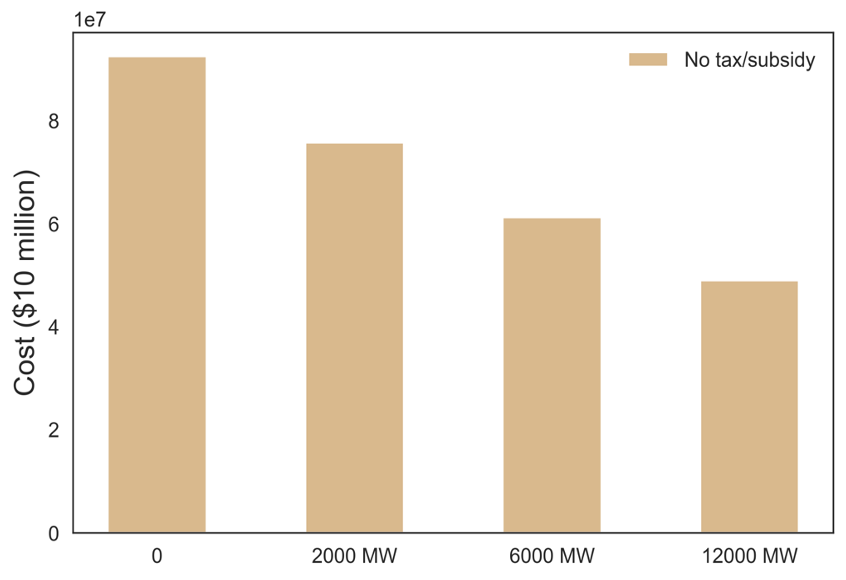
Figure 1a,b: (a) Shows changes in system cost with increasing wind generation capacity. (b) Shows changes in carbon emissions with increasing wind generation capacity. Both figures assume no tax or subsidy incentives for wind generation. All non-wind generators are assumed to be running on coal.
Not all installed wind capacity is utilized. The wind capacity utilization factor varies over the period depending on the environmental and system conditions. Consequently, carbon emissions, which decrease as more wind powered energy is integrated into the system, do not fall as significantly as the costs. Presumably, wind integration helps reduce the start-up and shut-down costs by providing a cheaper alternative to meet demand, as opposed to the expensive coal generators that can potentially raise the system cost. The correlation between cost and emissions reductions isn't very high, suggesting cost savings from non-dispatch costs (no-load costs, start-up costs, etc.).
Without regard to subsidies or carbon taxes, the benefits of wind integration in the ISO network extend to cost savings and lower emissions. Specifically, costs reduce to almost half as we move from the base case to installing 12000 MW wind capacity. Next we consider the impact on prices and generator revenues.
2. Prices decrease with increasing wind integration and at higher levels of wind capacity, price peaks disappear
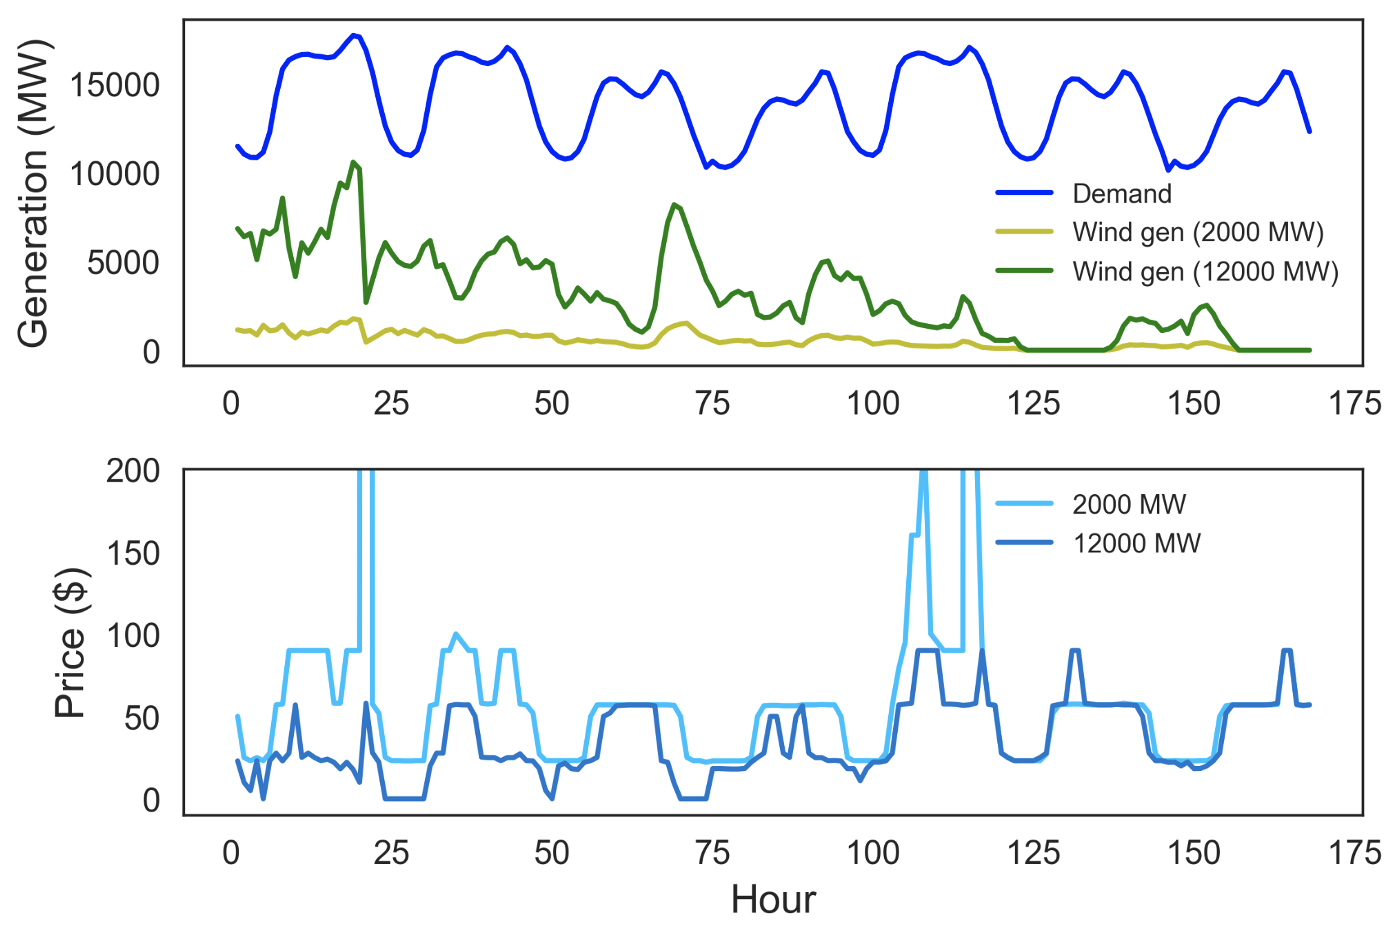
Figure 2: The figure plots hourly generation (in MW) and prices ($/MWh) for two scenarios of wind capacity (2000 MW and 12000 MW) under no incentives. In the top panel, the blue line represents total energy demand and the green and yellow lines represent wind energy generation.
As shown in figure 2, prices fluctuate with changes in total consumer demand as well as the share of demand met through wind generation. Because of zero marginal costs, prices drop as a higher share of demand is supplied through wind. However, low levels of wind integration (capacity = 2000 MW) are unable to address the unusual peaks in prices which arise due to sudden changes in demand. High wind integration, specifically installing 12000 MW wind removes the peaks by supplying reliable power during peak hours, thereby protecting consumers from price fluctuations. The price trends under 12000 MW capacity in Figure 2 show that prices become less volatile as more capacity is added. This suggests higher wind integration might be welfare-enhancing on the consumer-side while also reducing system costs and emissions.
3. Wind curtailment ratio close to zero in all the scenarios of wind integration
We also explore the role of incentives, specifically carbon taxes and wind subsidies for integration of wind-powered generation into the system. Figure 3 shows that at both low and medium wind capacity levels (2000 and 6000 MW), all the available capacity is utilized. The wind curtailment ratio, which we define as the fraction of available wind capacity that wasn’t integrated into the system is zero in both these cases. As capacity is increased to 12000 MW, a small fraction (~2.5 percent) is not utilized, which is insignificant. Hence, without using the policy instruments of taxes or subsidies, we’re able to integrate almost the entire available wind capacity for all scenarios of capacity. This raises a question mark on the need for incentives to increase wind integration. We address this question in more detail next.
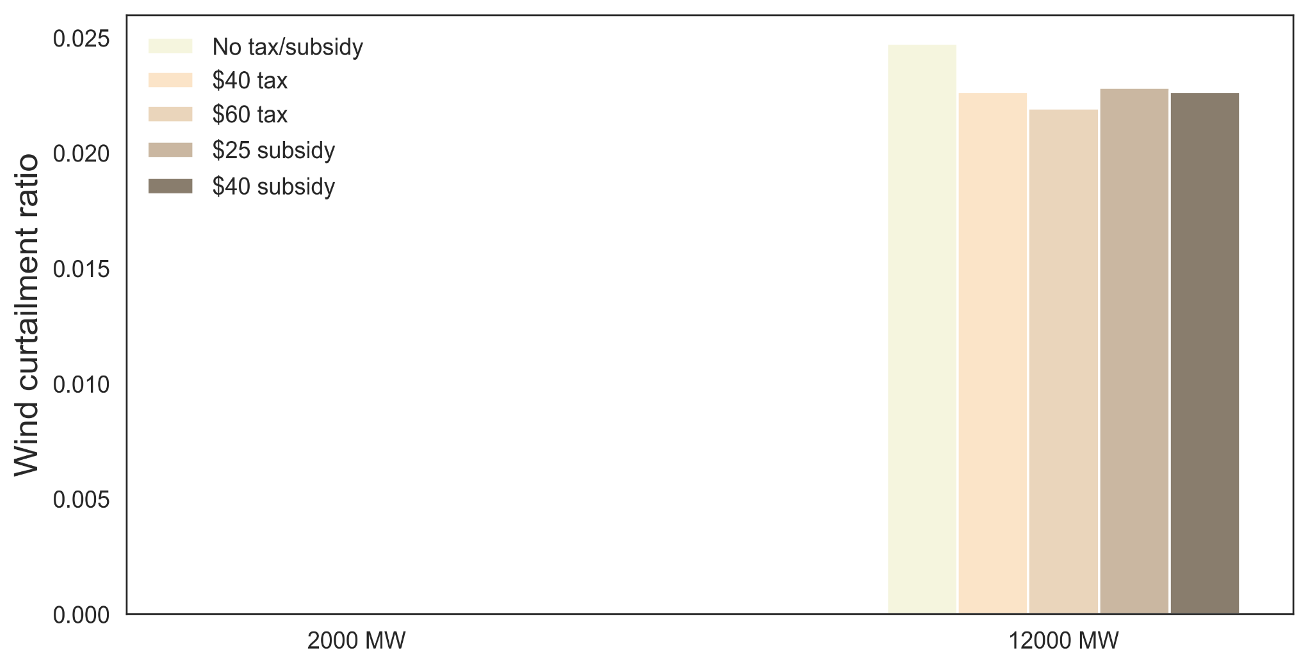
Figure 3: The figure shows wind curtailment ratio (WCR) under different scenarios of carbon taxes/subsidy and wind generation capacity.
4. Incentives such as carbon taxes/subsidies do not affect WCR or carbon emissions, but change the system cost and prices.
As shown in fig 3, WCR is close to zero both with and without incentives - tax or subsidy. Since, wind utilization doesn't change with these incentives, we don't see a change in carbon emissions either (Figure 4). Hence, incentives do nothing to counterfactual emissions or wind curtailment ratio. However, they affect costs and prices:
Carbon taxes increase the cost of power generation from non-renewables. Consequently, they raise the system cost. This is then passed on to consumers in the form of higher energy prices. On the other hand, subsidies provide a cash transfer to producers of wind powered energy, thereby lowering the total system cost. This then results in lower prices. However, lower prices are realized only during hours when wind generation is able to provide a significant part of the demand. In most periods, the price with and without incentives is identical. There's an important caveat to promoting subsidies. To fund them, the exchequer would need to raise other kinds of taxes which are often passed on to consumers, both directly and indirectly. Figure 5 and 6 show how taxes and subsidies affect the cost and prices under various scenarios of incentives for the 12000 MW installed wind capacity case.
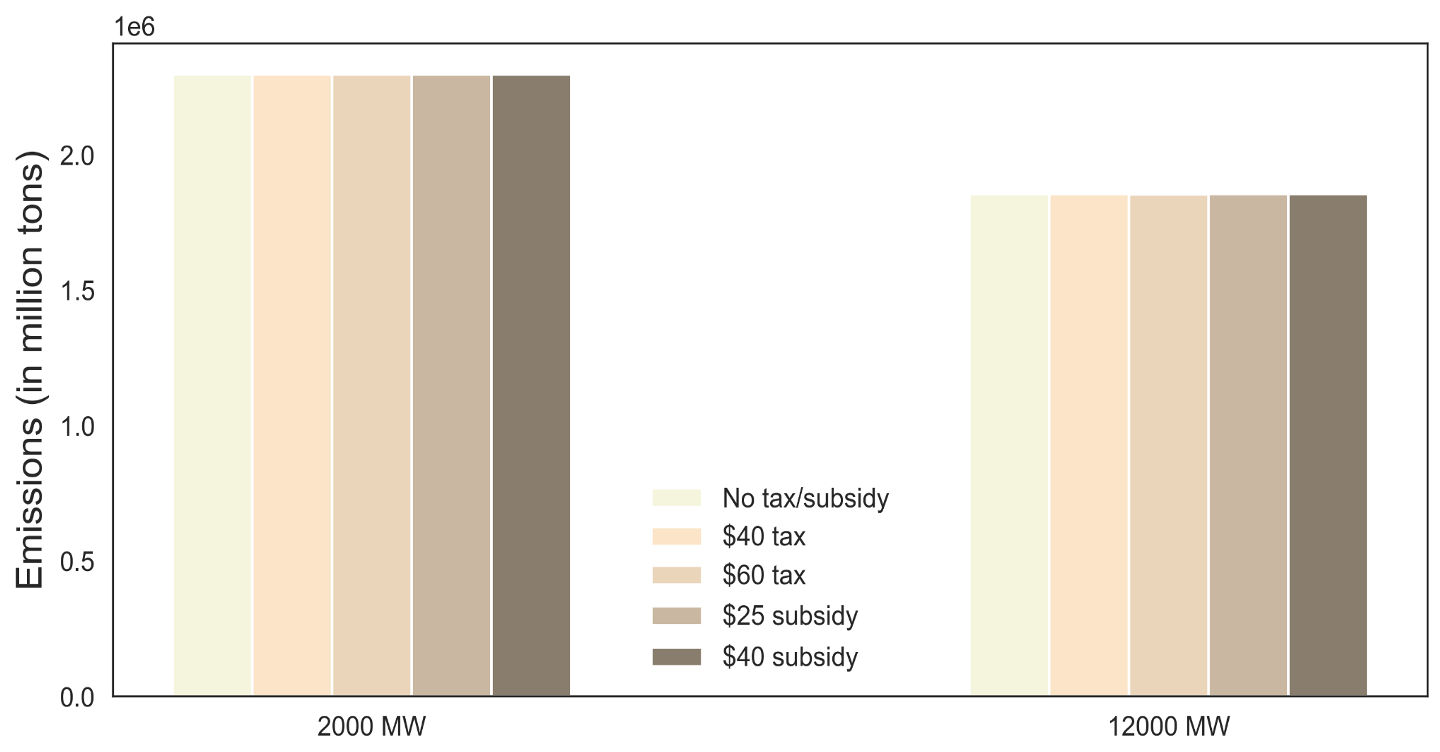
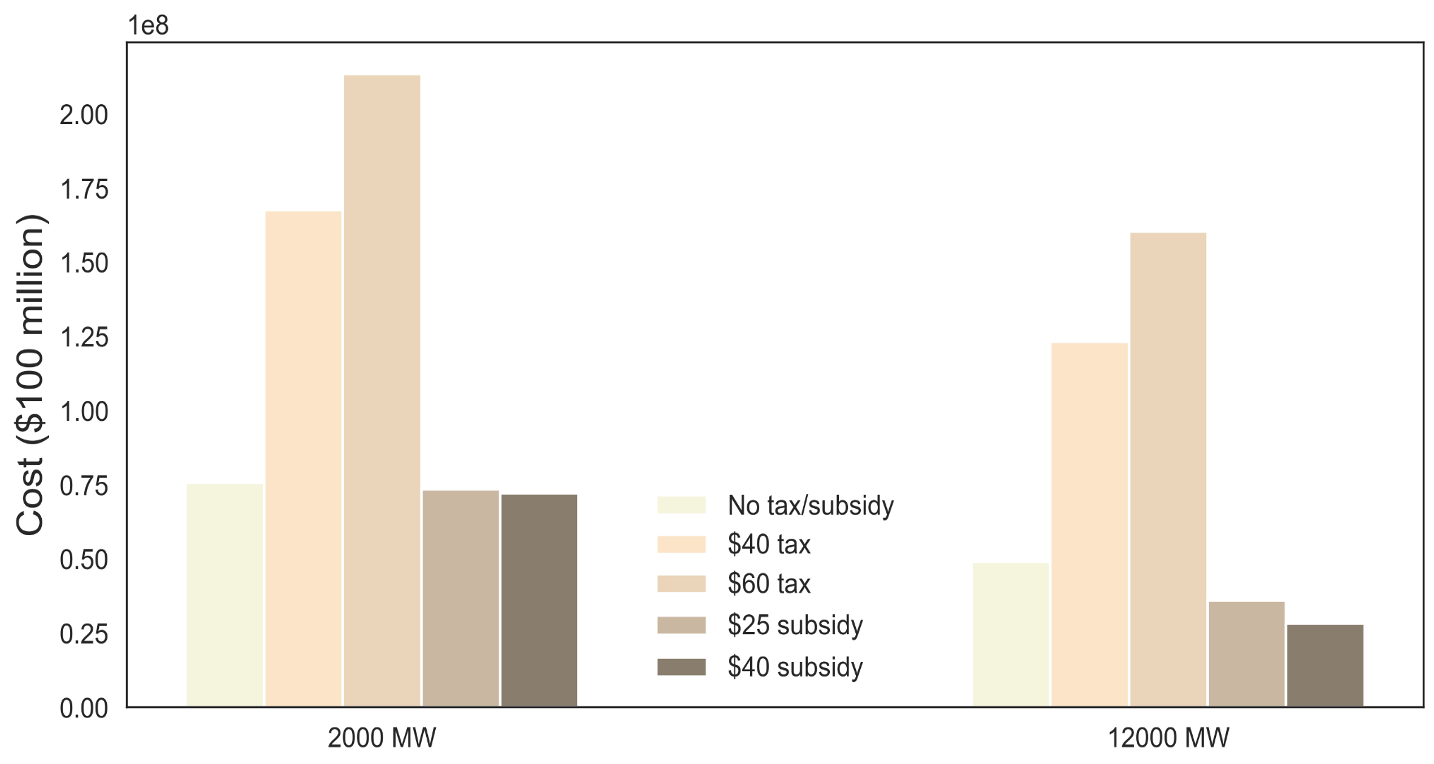
Figure 4,5: (4) Carbon emissions (in million tons) under various scenarios of incentives and wind capacity. (5) Cost of generation (in $100 million) under various scenarios of incentives and wind capacity.
5. Generator profits decrease at higher levels of wind integration, and reduce further with taxes
Table 1 shows generator profits under various scenarios. Profits increase at low wind capacity but decrease as more wind is added. The cost savings from lower generation costs are overpowered by lower generation levels at high wind capacity, reducing profits. Taxes/incentives accentuate it as part of the increased relative cost imposed by these incentives is borne by the generator and is not passed on entirely to the consumer in the form of high prices. Incentives are costly to the generators.
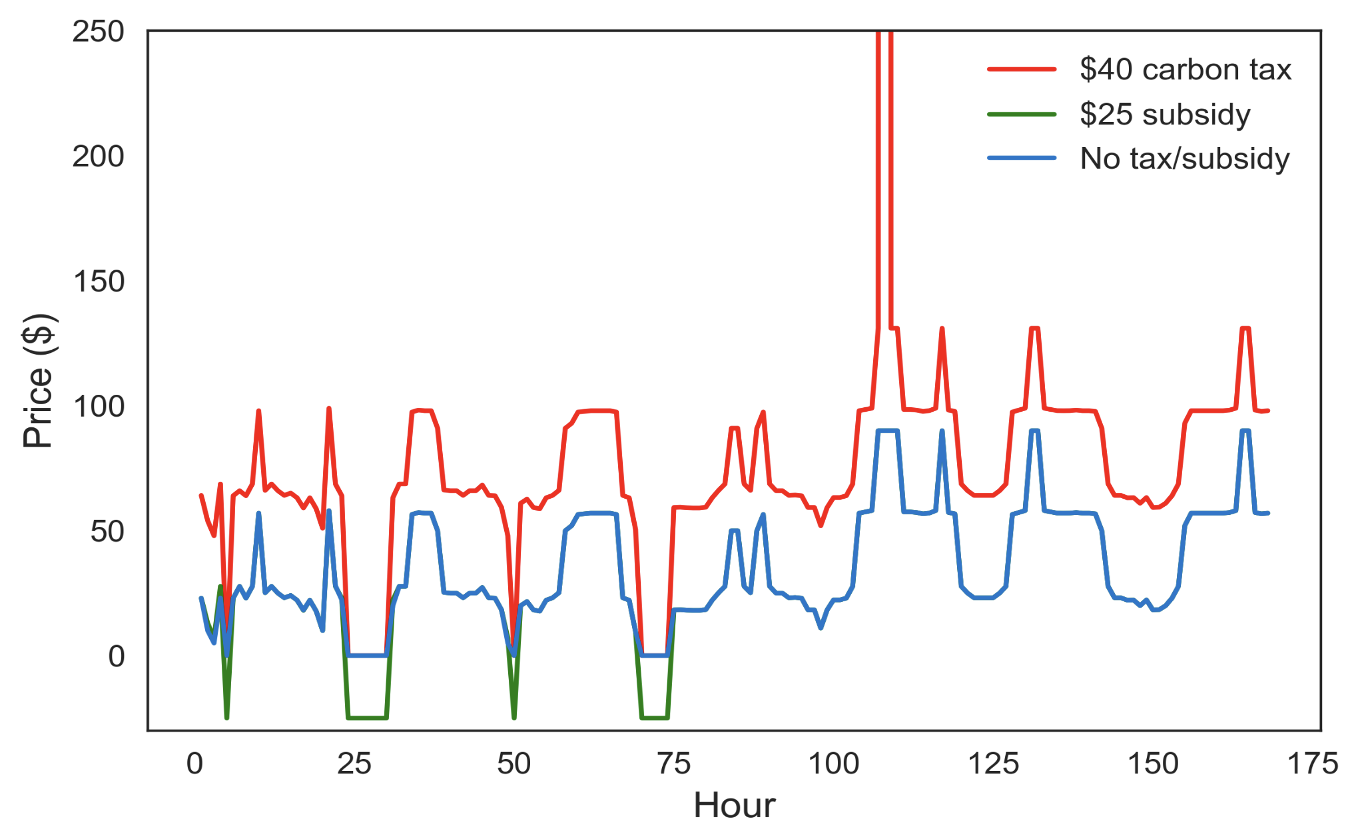
Figure 6: Hourly price fluctuations under different scenarios of carbon taxes/subsidies for the 12000 MW installed wind capacity case.
| Wind Capacity (MW) | Carbon tax ($/ton CO2) | Subsidy ($/MWH wind gen) | Generator Profit ($ million) |
|---|---|---|---|
| 0 | 0 | 0 | 220.4 |
| 2000 | 0 | 0 | 351.2 |
| 6000 | 0 | 0 | 178 |
| 12000 | 0 | 0 | 25 |
| 2000 | 40 | 0 | 259 |
| 2000 | 0 | 25 | 353.4 |
| 12000 | 40 | 0 | 157 |
| 12000 | 0 | 25 | 36 |
Table 1: Detailed breakdown of the effects of carbon taxes and subsidy implementations on ISO generator profits along different integration regimes.
We find that integrating wind into the system is beneficial in terms of lowering generation costs, emissions and consumer prices. The estimated wind curtailment ratio is almost insignificant in all scenarios, including without incentives. Imposing carbon taxes/subsidies doesn't alter the WCR or carbon emissions but increases the system cost (taxes), increases prices (taxes) or leaves them unchanged (subsidy) and reduces generator profits. As such, the main conclusion of this study is that incentives do not serve a meaningful purpose as far as the parameters we discussed are concerned and only reduce generator profits. Carbon taxes only increase prices while doing nothing to WCR or emissions. Subsidies lower prices slightly but have no effect on WCR or emissions.
Hence, we conclude that higher wind integration must be endorsed by ISO-NE, specifically 12000 MW capacity must be pursued. This should be done without imposing the instruments of carbon taxes or subsidies.
| [1] | EIA.gov |